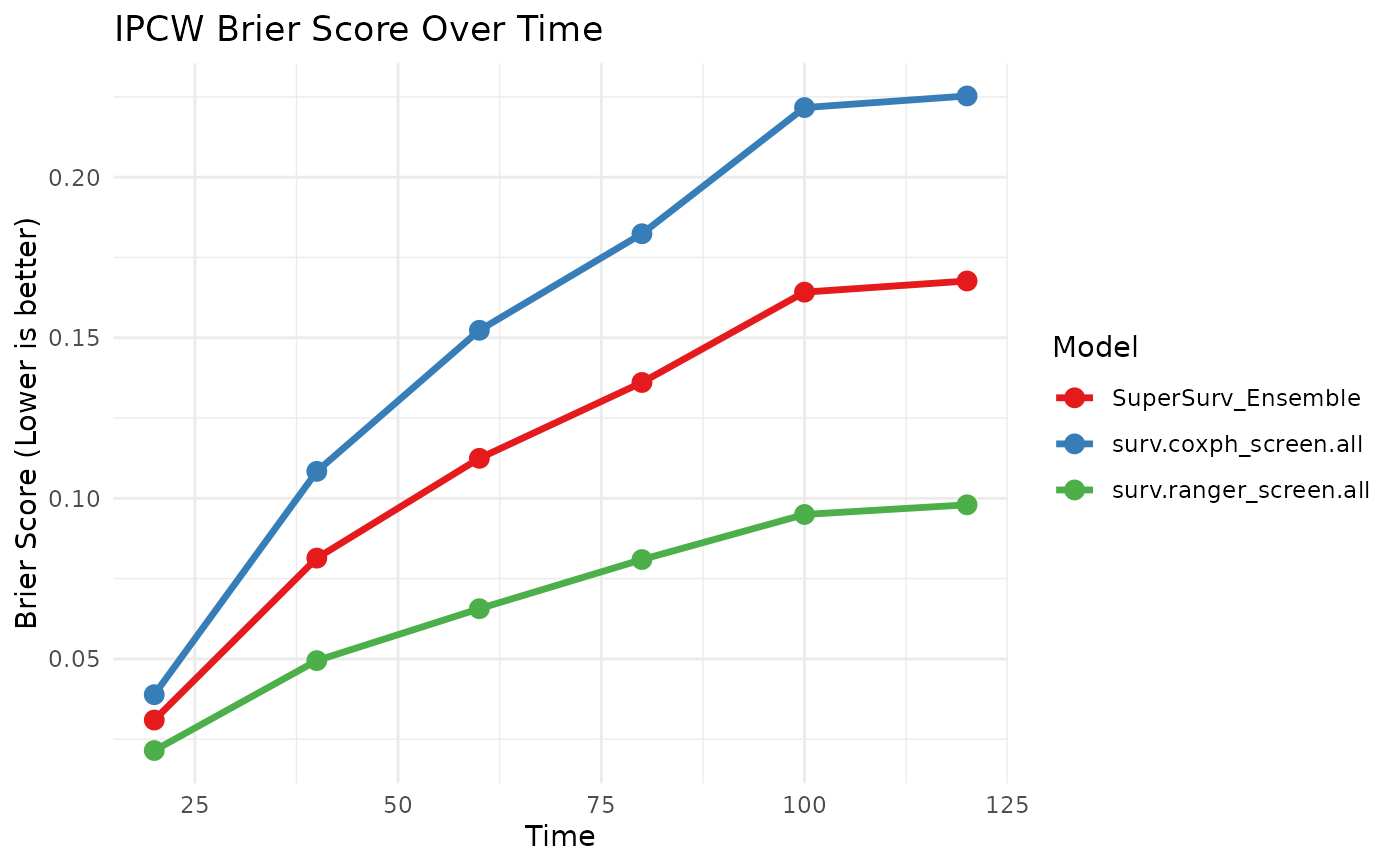
Generates time-dependent performance curves comparing the SuperSurv ensemble against its base learners, or evaluates a single standalone learner.
Usage
plot_benchmark(
  object,
  newdata,
  time,
  event,
  eval_times,
  metrics = c("brier", "auc", "cindex"),
  verbose = FALSE
)
Arguments
- object
A fitted SuperSurv object OR a fitted standalone learner.
- newdata
A data.frame of test covariates.
- time
Numeric vector of observed follow-up times for the test set.
- event
Numeric vector of event indicators for the test set.
- eval_times
Numeric vector of times at which to evaluate predictions.
- metrics
Character vector specifying which plots to return. Options: "brier", "auc", "cindex". Defaults to all three.
- verbose
Logical; if TRUE, progress messages are shown. Defaults to FALSE.
Examples
if (requireNamespace("glmnet", quietly = TRUE)) {
  data("metabric", package = "SuperSurv")
  dat <- metabric[1:120, ]
  x_cols <- grep("^x", names(dat))[1:5]
  X <- dat[, x_cols, drop = FALSE]
  eval_times <- seq(20, 120, by = 20)

  fit <- SuperSurv(
    time = dat$duration,
    event = dat$event,
    X = X,
    newdata = X,
    new.times = eval_times,
    event.library = c("surv.coxph", "surv.ranger"),
    cens.library = c("surv.coxph"),
    control = list(saveFitLibrary = TRUE)
  )

  plot_benchmark(
    object = fit,
    newdata = X,
    time = dat$duration,
    event = dat$event,
    eval_times = eval_times,
    metrics = c("brier")
  )
}