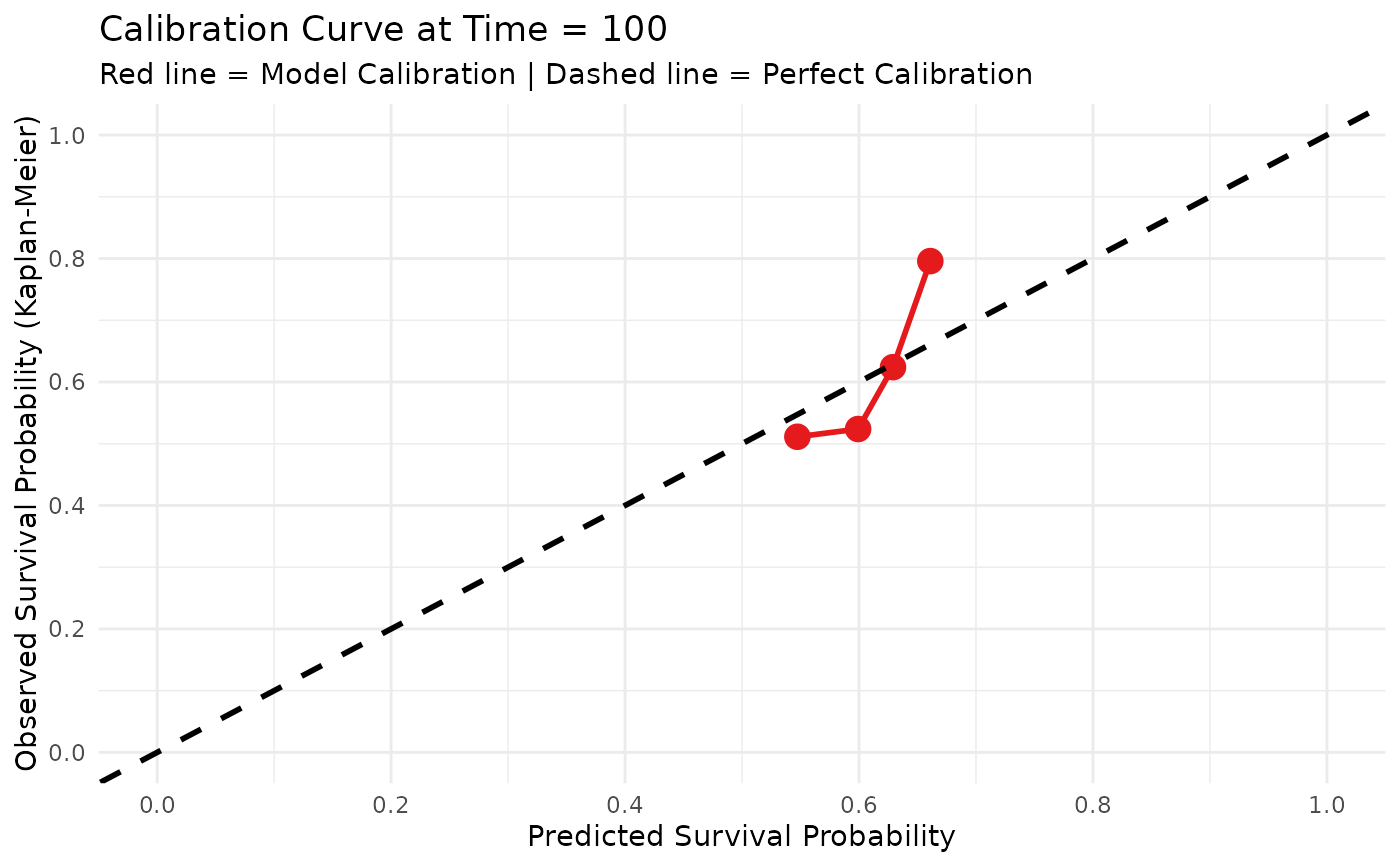
Plot Survival Calibration Curve
Arguments
- object
A fitted SuperSurv object OR a standalone base learner.
- newdata
A data.frame of test covariates.
- time
Numeric vector of observed follow-up times for the test set.
- event
Numeric vector of event indicators for the test set.
- eval_time
Numeric. A single time point at which to assess calibration.
- bins
Integer. Defaults to 5.
Examples
if (requireNamespace("glmnet", quietly = TRUE)) {
  data("metabric", package = "SuperSurv")
  dat <- metabric[1:120, ]
  x_cols <- grep("^x", names(dat))[1:5]
  X <- dat[, x_cols, drop = FALSE]
  eval_times <- seq(20, 120, by = 20)

  fit <- SuperSurv(
    time = dat$duration,
    event = dat$event,
    X = X,
    newdata = X,
    new.times = eval_times,
    event.library = c("surv.coxph", "surv.ridge"),
    cens.library = c("surv.coxph"),
    control = list(saveFitLibrary = TRUE)
  )

  plot_calibration(
    object = fit,
    newdata = X,
    time = dat$duration,
    event = dat$event,
    eval_time = 100,
    bins = 4
  )
}