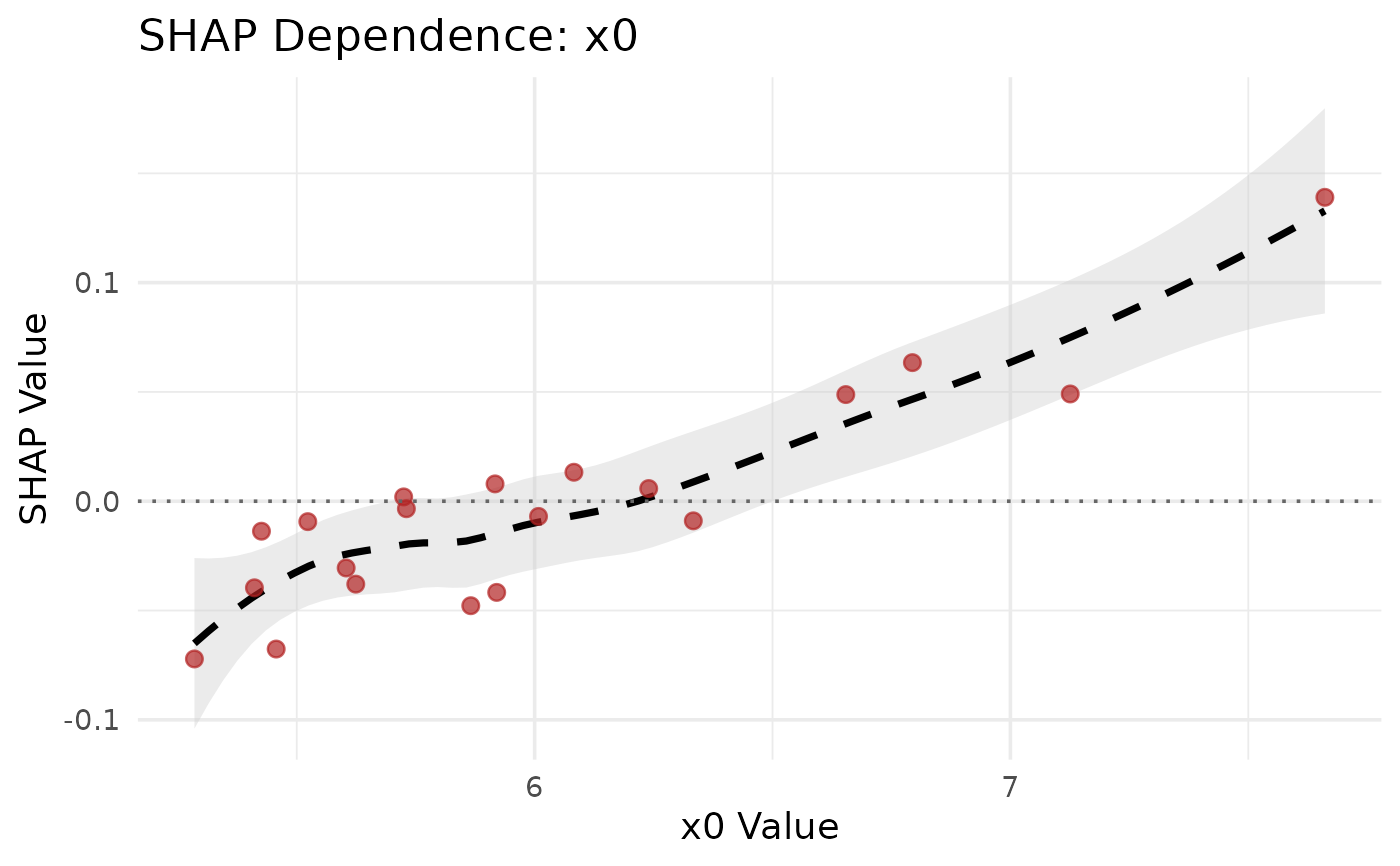
Plot SHAP Dependence for SuperSurv
Arguments
- shap_values
The output from
explain_kernel().- data
The original covariate data used for the explanation (X_explain)
- feature_name
String name of the column to plot
- title
Optional custom title.
Examples
if (requireNamespace("fastshap", quietly = TRUE) &&
    requireNamespace("glmnet", quietly = TRUE)) {
  data("metabric", package = "SuperSurv")
  dat <- metabric[1:80, ]
  x_cols <- grep("^x", names(dat))[1:5]
  X <- dat[, x_cols, drop = FALSE]
  new.times <- seq(20, 120, by = 20)

  fit <- SuperSurv(
    time = dat$duration,
    event = dat$event,
    X = X,
    newdata = X,
    new.times = new.times,
    event.library = c("surv.coxph", "surv.ridge"),
    cens.library = c("surv.coxph"),
    control = list(saveFitLibrary = TRUE)
  )

  shap_values <- explain_kernel(
    model = fit,
    X_explain = X[1:20, , drop = FALSE],
    X_background = X[21:50, , drop = FALSE],
    nsim = 5
  )

  plot_dependence(
    shap_values = shap_values,
    data = X[1:20, , drop = FALSE],
    feature_name = colnames(X)[1]
  )
}