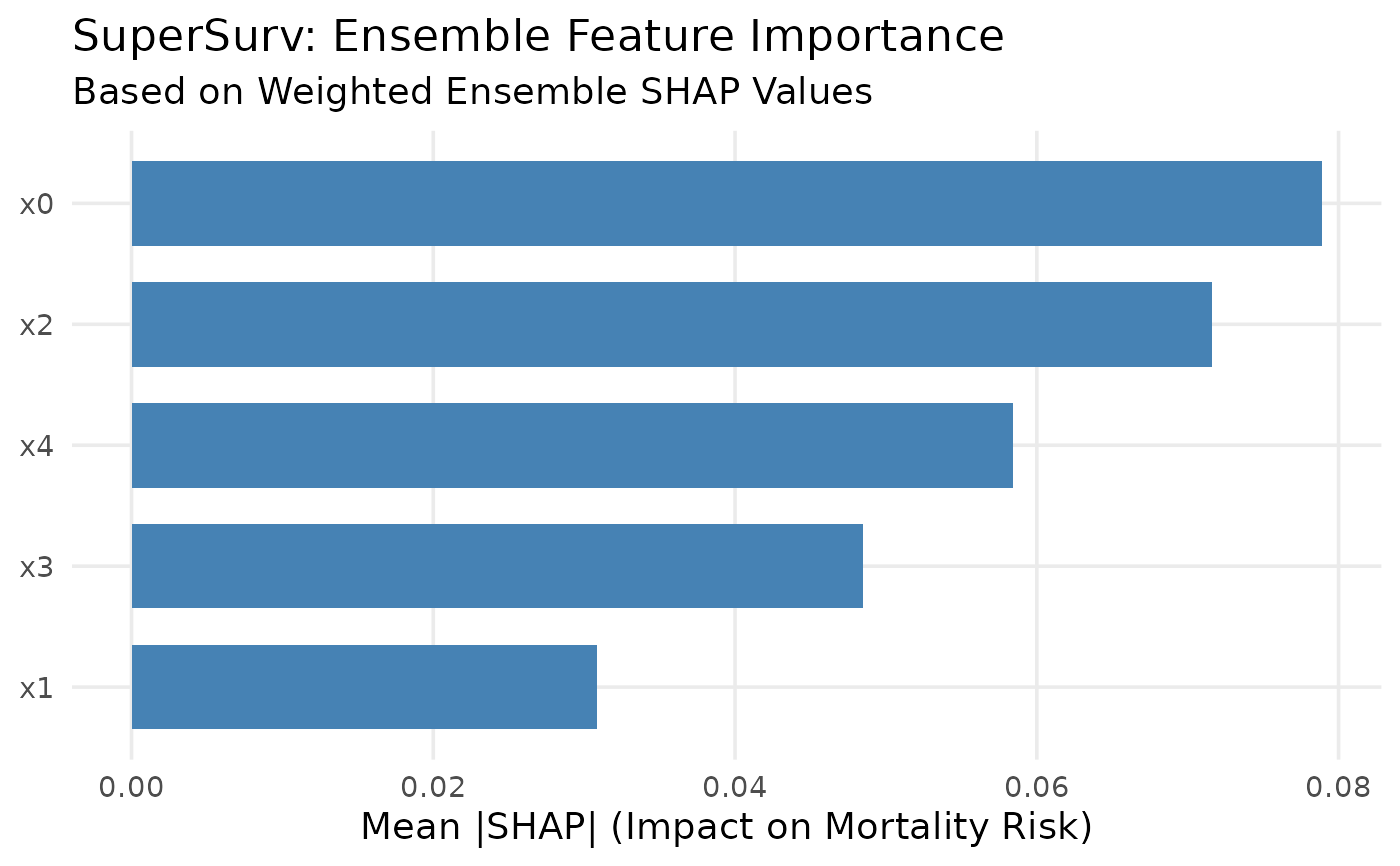
Plot Global Feature Importance for SuperSurv
Usage
plot_global_importance(
  shap_values,
  title = "SuperSurv: Ensemble Feature Importance",
  top_n = 10
)
Arguments
- shap_values
The output from
explain_kernel().- title
Plot title.
- top_n
Number of features to show (default 10)
Examples
if (requireNamespace("fastshap", quietly = TRUE) &&
    requireNamespace("glmnet", quietly = TRUE)) {
  data("metabric", package = "SuperSurv")
  dat <- metabric[1:80, ]
  x_cols <- grep("^x", names(dat))[1:5]
  X <- dat[, x_cols, drop = FALSE]
  new.times <- seq(20, 120, by = 20)

  fit <- SuperSurv(
    time = dat$duration,
    event = dat$event,
    X = X,
    newdata = X,
    new.times = new.times,
    event.library = c("surv.coxph", "surv.ridge"),
    cens.library = c("surv.coxph"),
    control = list(saveFitLibrary = TRUE)
  )

  shap_values <- explain_kernel(
    model = fit,
    X_explain = X[1:10, , drop = FALSE],
    X_background = X[11:40, , drop = FALSE],
    nsim = 5
  )

  plot_global_importance(shap_values, top_n = 5)
}