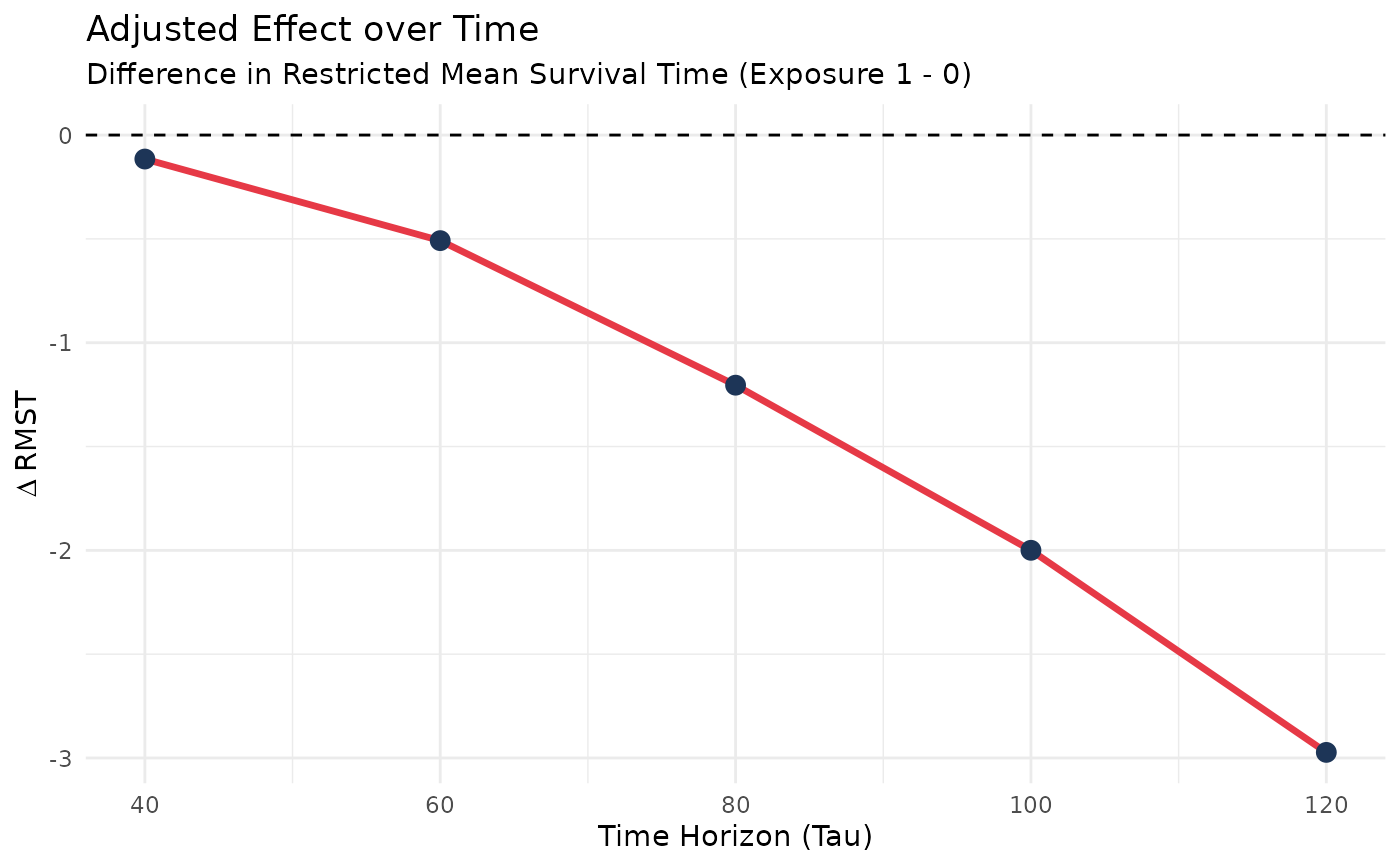
Generates a curve showing how the adjusted marginal restricted mean survival time (RMST) contrast evolves across a sequence of restriction times.
Usage
plot_marginal_rmst_curve(
  fit,
  data,
  trt_col,
  times,
  tau_seq,
  inference = FALSE,
  B = 200,
  seed = NULL,
  ci_level = 0.95
)
Arguments
- fit
A fitted
SuperSurvensemble object.- data
A
data.framecontaining the covariates and the binary grouping variable.- trt_col
Character string. The exact name of the binary grouping variable in
data.- times
Numeric vector of time points matching the prediction grid.
- tau_seq
Numeric vector. A sequence of restriction times (
tau) to evaluate and plot.- inference
Logical; if
TRUE, compute perturbation-based confidence intervals. Defaults toFALSE.- B
Integer. Number of perturbation replicates used when
inference = TRUE. Defaults to200.- seed
Optional integer seed for reproducibility.
- ci_level
Numeric scalar in
(0,1)specifying the confidence level for the confidence interval. Defaults to0.95.
Details
If inference = TRUE, the function additionally displays perturbation-based
Wald confidence intervals at each value of tau.
Examples
data("metabric", package = "SuperSurv")
dat <- metabric[1:80, ]
x_cols <- grep("^x", names(dat), value = TRUE)[1:5]
X <- dat[, x_cols, drop = FALSE]
new.times <- seq(20, 120, by = 20)

fit <- SuperSurv(
  time = dat$duration,
  event = dat$event,
  X = X,
  newdata = X,
  new.times = new.times,
  event.library = c("surv.coxph", "surv.glmnet"),
  cens.library = c("surv.coxph"),
  control = list(saveFitLibrary = TRUE)
)

tau_grid <- seq(40, 120, by = 20)
plot_marginal_rmst_curve(
  fit = fit,
  data = dat,
  trt_col = "x4",
  times = new.times,
  tau_seq = tau_grid,
  inference = TRUE,
  B = 100,
  seed = 123
)
#> Adjusted Delta RMST at tau = 40: -0.124 time units | SE = 0.007 | 95% CI = [-0.137, -0.11]
#> Adjusted Delta RMST at tau = 60: -0.544 time units | SE = 0.023 | 95% CI = [-0.59, -0.499]
#> Adjusted Delta RMST at tau = 80: -1.29 time units | SE = 0.044 | 95% CI = [-1.376, -1.204]
#> Adjusted Delta RMST at tau = 100: -2.141 time units | SE = 0.059 | 95% CI = [-2.257, -2.025]
#> Adjusted Delta RMST at tau = 120: -3.183 time units | SE = 0.077 | 95% CI = [-3.333, -3.033]