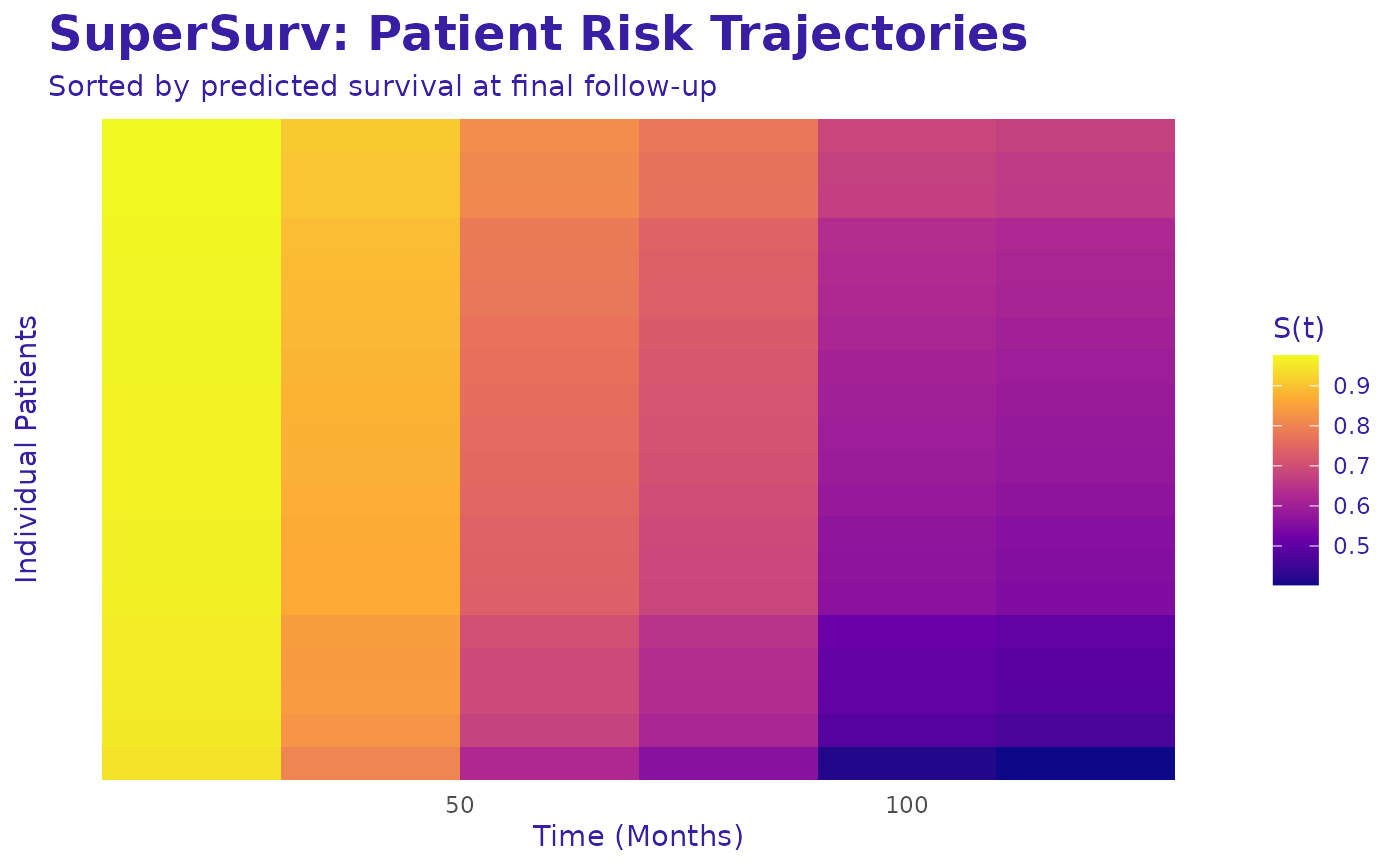
Survival Probability Heatmap
Examples
if (requireNamespace("glmnet", quietly = TRUE)) {
  data("metabric", package = "SuperSurv")
  dat <- metabric[1:80, ]
  x_cols <- grep("^x", names(dat))[1:5]
  X <- dat[, x_cols, drop = FALSE]
  times <- seq(20, 120, by = 20)

  fit <- SuperSurv(
    time = dat$duration,
    event = dat$event,
    X = X,
    newdata = X,
    new.times = times,
    event.library = c("surv.coxph", "surv.ridge"),
    cens.library = c("surv.coxph"),
    control = list(saveFitLibrary = TRUE)
  )

  plot_survival_heatmap(
    object = fit,
    newdata = X[1:20, , drop = FALSE],
    times = times
  )
}